Tuesday, March 8, 2011

Population and Development Report Resources

  • BBC Country Profiles
  • CIA World Factbook
  • SweetSearch - good for finding current information/news articles
  • Half the Sky website - good resource for finding organizations working in countries
  • Wikimedia - good for images that are in the public domain (free for you to use)
  • Gapminder - good for showing correlation between different factors and growth rate/fertility rate. Use this when you are proposing solutions. You will have to capture with screenshot.
Citation PPT

**Wikipedia is not a resource for information in your report. Wikipedia can help you find resources to use use in your report. Do not CITE wikipedia. Find the original article (look at footnotes of wikipedia article) or use legitimate resources.**


All images, graphs, diagrams, information that comes from another resource besides your brain MUST be CITED in the text of your report AND on the works cited page.

Monday, March 7, 2011

Population and Development Report


Homework:

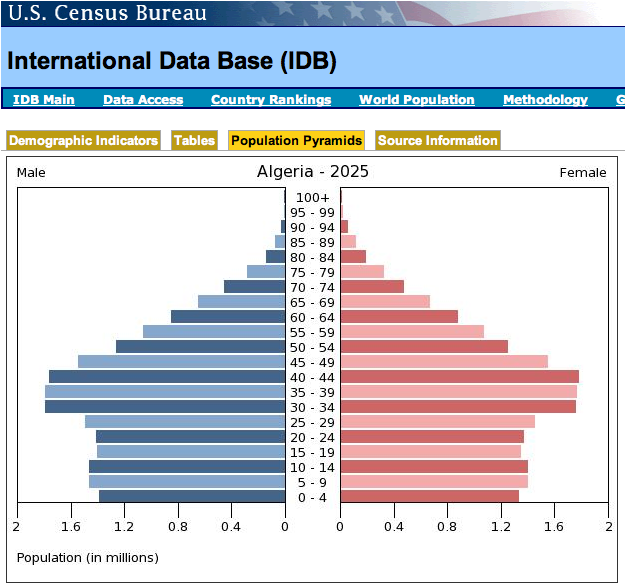
Get current and projected (2025) population pyramids for your two selected countries HERE.

Insert these into a word document and upload that word document to Google Docs. Share with me (savage DOT catherine @ gmail.com).

Write a paragraph analyzing the current population situation and future trends in ONE or your countries. Provide as much detail about the different parts of the pyramid as you can. USE ONLY the pyramid as a reference. This does not require additional research.


Don't forget to answer the questions about Half the Sky in the last blog post.

Skit video extra credit: Create a skit and video it. Your skit must demonstrate the cultural and societal pressures that contribute to family planning decisions in areas with high fertility rates and high birth rates. You should use the handout that I gave you a few weeks ago to create an original script that is creative and educational.

"Gendercide" article extra credit: Come to computer lab after school on Wednesday for oral quiz on article.


In some countries (like the U.S.) the UNFPA is seen as a controversial organization that should have its funding reduced. This is sad.

Saturday, March 5, 2011

Half the Sky Reading


Sorry for the delay. I will not count this assignment late if you submit by Tuesday. But, you are required to have read and be ready to discuss the article that I gave you in class tomorrow.

Please write out the answers to the following questions.
  1. What policies or programs are described in the article?
  2. Which programs are successful and why? 

What? Surprised to see Angelina and Shakira with the same geography homework? :-) Turns out they also want to learn more about the plight of women around the world.


Monday, February 28, 2011

Choropleth Map for Population Growth Factors

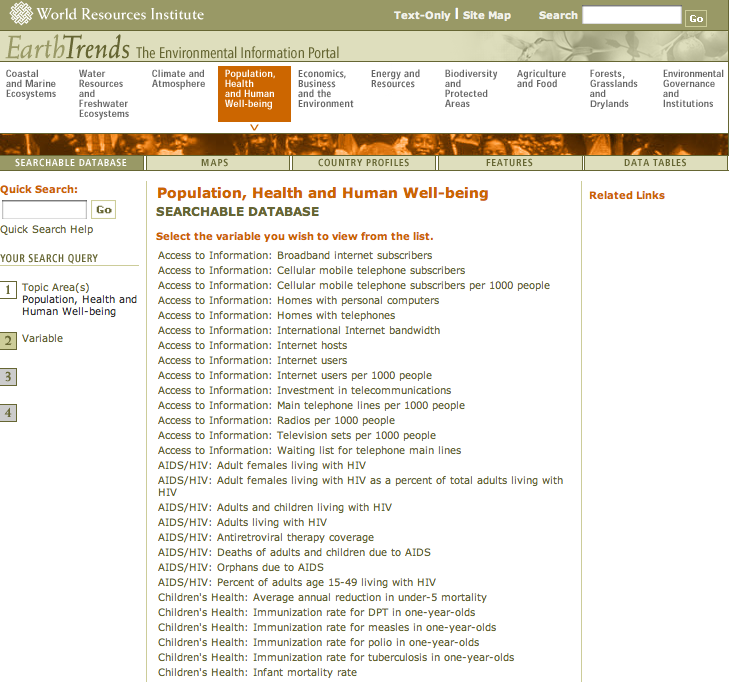
Go HERE: http://earthtrends.wri.org/searchable_db/index.php?theme=4 to get the data that you need.
Look below to see what data set you will use to create your choropleth map.

Map must be NEAT, ACCURATE, and INCLUDE all MAP ELEMENTS (obviously including legend).


Please disregard the number that I gave you in class. 

  • Moira - Literacy: Female lit. rate as % of male lit. rate
  • Pamela - Labor: Female professional and technical workers
  • Red - Labor: Female legislators and senior officials and managers
  • Jun - Education: Secondary school gender parity in gross (look this up to figure out what the heck it means)
  • Tommy - Education: Average length of schooling
  • Minki - Children's Health: Child Mortality Rate
  • Francis - AIDS/HIV: Adult females living w/ HIV as % of total
  • Anton - Water and Sanitation: Access to improved Sanitation (look this up to see what it means)
  • Ida - Public Health: Maternal Mortality Rate
  • Floyd - Urban and Rural Areas: Urban population as % of total
  • Dennis - Access to Information: Internet users per 1000
  • Cyril - Children's Health: Infant mortality rate (you may also use population data sheet for this information)
  • Doenemi - Children's Health: Underweight children under 5
  • Daniel - GNI PPP (use population data sheet)
IMPORTANT!!!

Highlight all of the countries to get the data for all the countries at once.


Make sure that you understand your indicator, the units (is it a %, number per 1000, $?), and what it is actually telling you. If you don't understand, look it up, or click on the "view technical notes" of your data set.


Use the most current data possible that is the most complete. For example, if you click on 2008 but there is only data for a few countries, try clicking on 2007 or 2006 and see if there is more information for more countries. (See screenshot below.)


Countries with no data should be GREY. (Unless you are using the color black, then you need to figure out something else that won't be confusing to readers.)


Tuesday, February 8, 2011

No questions. Just read.

No questions to answer, but please do read about the demographic transition model in your text pp 58-60. We will discuss tomorrow.

Thursday, February 3, 2011

Population Fundamentals

Geo Starter: 
Why do geographers use rates (per 1,000 population) rather than total sums?
For example, why do the population data sheets give us the number of births per 1,000 people in every country but does not tell us the total number of babies born in a year for each country?
Hint: the total number of births in China each year is 17 million.


HW:
Population Fundamentals I
#14 should read "Graph the major regions according to total population size (in descending order) for the present, for 2025, and for 2050. What trend can be observed in terms of population change? (use graph paper)
Population Fundamentals II
In question #2, it asks you to construct a bar graph showing the different PROPORTIONS of world populations by region. 
Do not go beyond question #4. You are not responsible for age-dependency ratio.

ONLY do ONE of the graphs: either the graph on Population Fundamentals I OR the graph on Population Fundamentals II.

Quiz on Monday! 
Study Pop Fund I & II, specifically the following concepts and how they apply to different countries.

most populous countries
crude birth rate
crude death rate
infant mortality rate
total fertility rate
rates versus total numbers
rate of natural increase
population projection
major region
subregion
life expectancy
That's it...I think... :-)